Deploying Prometheus and Grafana with Helm
Hello Folks! In this Blog I’ll guide you to deploy Prometheus and Grafana using Helm. So, Guys let’s get deep dive into this Practical →

Prometheus will help us monitor our Kubernetes Cluster and other resources running on it. Grafana will help us visualize metrics recorded by Prometheus and display them in fancy dashboard.
What is Prometheus?
Prometheus is a free software application used for event monitoring and alerting. It records real-time metrics in a time series database(allowing for high dimensionality ) built using a HTTP pull model , with flexible queries and real-time alerting.

What is Grafana?
Grafana is an open source visualization and analytics software. It allows you to query, visualize, alert on, and explore your metrics no matter where they are stored.

What is Helm?
In simple terms, Helm is a package manager for Kubernetes. Helm is the Kubernetes equivalent of yum or apt. Helm deploys charts, which you can think of as a packaged application. It is a collection of all your versioned, pre-configured application resources which can be deployed as one unit. Apps deployed from Helm Charts can then be leveraged together to meet a business need, such as CI/CD or blogging platforms.

So, Guys it’s time to move to the Practical Part →
Is there any Pre-requisites?🤔
- A Kubernetes Cluster.
- Helm to be Installed.
- Some basics of Helm is Required.
Installing Prometheus using Helm Charts…
Step 1: Adding the Helm Repository.
Search for the Prometheus Chart.
helm search hub prometheus
And now add the Helm Repo…
Here is a command to add the Helm Repo.
helm repo add <name> <url> Confirm it using: helm repo list

Step 2: Installing Prometheus.
After the Repo is ready we can simply install it.
helm install prometheus prometheus-community/prometheus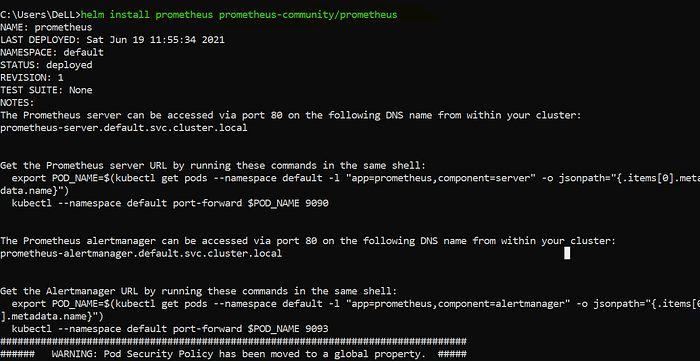
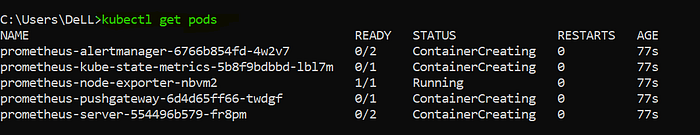
Once the chart is installed, you can check the with following commands:
 kubectl get pods

 helm list kubectl get svc
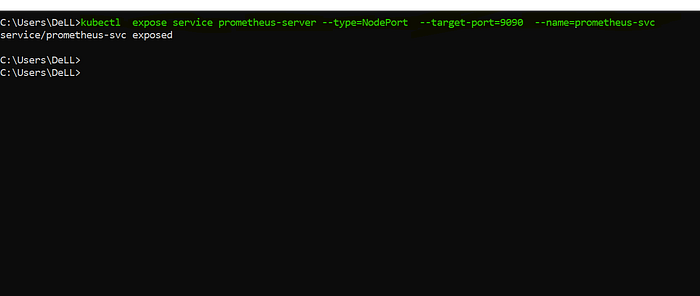
Step 3: Exposing Prometheus so that we can have access to it’s Portal.
Since Prometheus & Grafana services are available within a cluster (ClusterIP is the default Kubernetes service), therefore they can not be accessed outside of cluster.
In order to access the web GUI from outside of cluster, on our local machine we need to change default ClusterIP services to NodePort (Kubernetes transparently routes incoming traffic on the NodePort to your service).
kubectl expose service prometheus-server --type=NodePort --target-port=9090 --name=prometheus-svc
Note: If you are installing this chart on cloud (AWS, GCP), you can change the type from ClusterIP to LoadBalancer. And you can access Prometheus & Grafana with Public Ip (External Ip).
It’s Testing time…🙈
Grab the IP of Kubernetes Cluster and also the port number provided by Kubernetes Service and browse it in your Browser.
<IP_Address_of _Cluster:Service_port_number>And here comes the Dashboard of Prometheus.
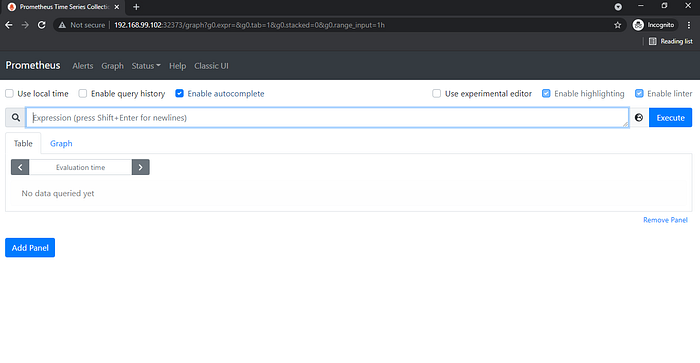
Voila! One milestone achieved…
Installing Grafana using Helm Charts.
Step 1: Adding the Helm Repo.
Search for the Grafana Chart.
helm search hub grafana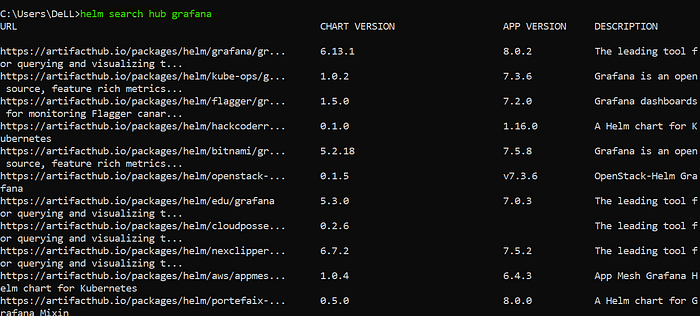
And now add the Helm Repo…
Here is a command to add the Helm Repo.
helm repo add <name> <url> Confirm it using: helm repo list

Step 2: Installing Grafana.
After the Repo is ready we can simply install it.
helm install <name> <repo_name>/grafana
Step 3: Exposing Grafana so that we can have access to it’s Portal.
kubectl expose service grafana --type=NodePort --target-port=3000
--name=grafana-svc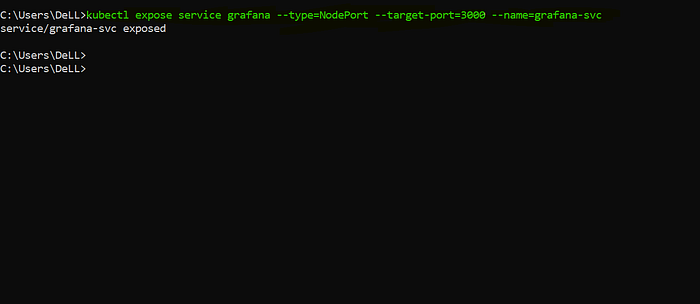
Note: Grafana is password protected by default, in order to retrieve the admin user password we can run the following command:
kubectl get secret — namespace default grafana -o jsonpath=”{.data.admin-password}” | base64 — decode ; echoIt’s Testing Time…🙈
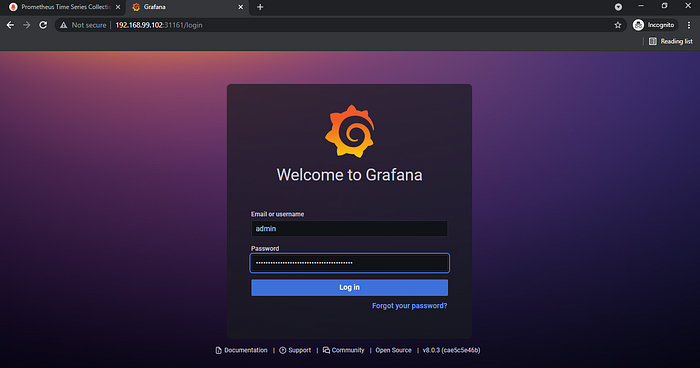
Grab the IP of Kubernetes Cluster and also the port number provided by Kubernetes Service and browse it in your Browser.
<IP_Address_of _Cluster:Service_port_number>And here comes the Portal of Grafana.
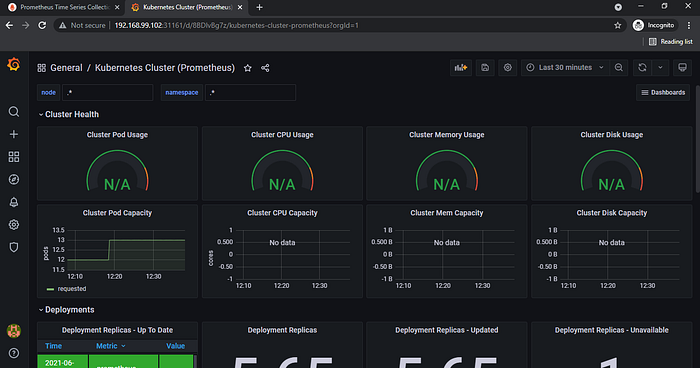
And then comes the Fancy Dashboard of Grafana.
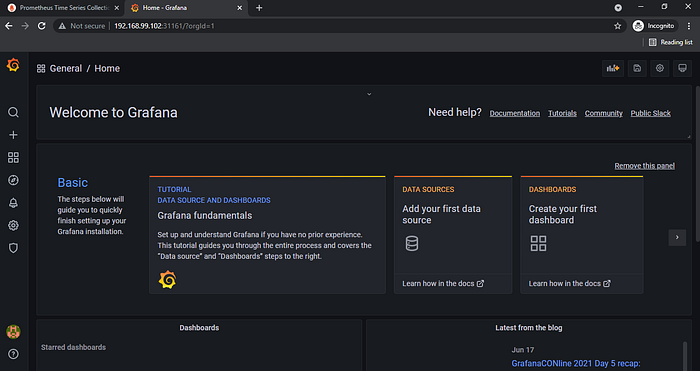
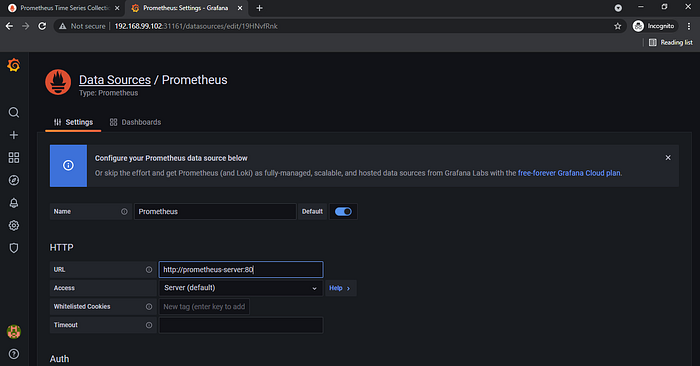
Configuring Prometheus Datasource.
Once we’re logged in to the admin interface, it’s time to configure the Prometheus Datasource.
We need to head to Configuration > Datasources and add a new Prometheus instance.
You can create a Dashboard and then you can enjoy visualizing…
Voila ! Another Milestone achieved…
Happy Visualizing!!
Hope you find my Blog Easy and Interesting!
Do Like Comment and give a clap😅
That’s all! Signing off Guys👋
Thank You!